1
2
3
4
5
6
7
8
9
10
11
12
13
14
15
16
17
18
19
20
21
22
23
24
25
26
27
28
29
30
31
32
33
34
35
36
37
38
39
40
41
42
43
44
45
46
47
48
49
50
51
52
53
54
55
56
57
58
59
60
61
62
63
64
65
66
67
68
69
70
71
72
73
74
75
76
77
78
79
80
81
82
83
84
85
86
87
88
89
90
91
92
93
94
95
96
97
98
99
100
101
102
103
104
105
106
107
108
109
110
111
112
113
114
115
116
117
118
119
120
121
122
123
124
125
126
127
128
129
130
131
132
133
134
135
136
137
138
139
140
141
142
143
144
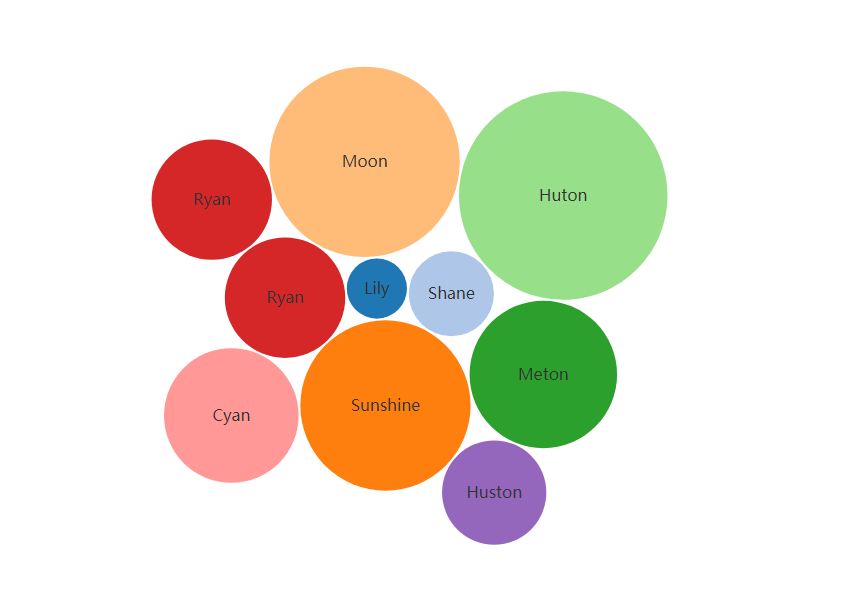
| let svg,
pack,
bubble,
simulation;
const width = document.body.clientWidth;
const height = document.body.clientHeight;
const centerX = width * 0.5;
const centerY = height * 0.5;
const scaleColor = d3.scaleOrdinal(d3.schemeCategory20);
let forceCollide = d3.forceCollide(d => d.r + 1);
getData();
function init(data) {
svg = d3.select("#bubble-word")
.append('svg')
.attr("xmlns", "http://www.w3.org/2000/svg");
pack = d3.pack()
.size([width, height])
.padding(1.5);
const forceStrength = 0.05;
simulation = d3.forceSimulation()
.force("x", d3.forceX(centerX).strength(forceStrength))
.force("y", d3.forceY(centerY).strength(forceStrength))
.force("charge", d3.forceManyBody())
.force("collide", forceCollide);
draw(data);
}
function createNodes(source) {
let root = d3.hierarchy({ children: source })
.sum(d => d.value);
const rootData = pack(root).leaves().map((d, i) => {
const data = d.data;
const color = scaleColor(data.name);
return {
x: centerX + (d.x - centerX) * 3,
y: centerY + (d.y - centerY) * 3,
id: "bubble" + i,
r: 0,
radius: d.r,
value: data.value,
name: data.name,
color: color,
}
});
rootData.sort((a, b) => b.value - a.value);
return rootData;
}
function draw(data) {
const nodes = createNodes(data);
console.log(nodes);
simulation.nodes(nodes).on("tick", ticked);
bubble = svg.selectAll(".bubble")
.data(nodes)
.enter().append("g")
.attr("class", "bubble")
.call(d3.drag()
.on("start", (d) => {
if (!d3.event.active) { simulation.alphaTarget(0.2).restart(); }
d.fx = d.x;
d.fy = d.y;
})
.on("drag", (d) => {
d.fx = d3.event.x;
d.fy = d3.event.y;
})
.on("end", (d) => {
if (!d3.event.active) { simulation.alphaTarget(0); }
d.fx = null;
d.fy = null;
})
);
var href = bubble.append("a")
.attr("href", d => "http://me.chjiyun.com/#"+d.name)
.attr("target", "_blank");
href.append("circle")
.attr("id", d => d.id)
.attr("r", 1e-6)
.attr("fill", d => d.color)
.transition().duration(2000).ease(d3.easeElasticOut)
.tween("circleIn", d => {
let i = d3.interpolateNumber(0, d.radius);
return (t) => {
d.r = i(t);
simulation.force("collide", forceCollide);
};
});
href.append("text")
.attr("dy", d => "0.35em")
.text(d => d.name);
}
function getData() {
d3.json("/data/bubble.json", function(err, data) {
if (err) throw err;
init(data.data);
});
}
function ticked() {
bubble.attr("transform", d => `translate(${d.x},${d.y})`)
.select("circle")
.attr("r", d => d.r);
}
|
